Monitoring, Debugging and Performance Analysis Tools for OpenMP
Monitoring and Debugging Threads:
-
Debuggers vary in their ability to handle threads. The TotalView debugger is LC’s recommended debugger for parallel programs. It is well suited for both monitoring and debugging threaded programs.
-
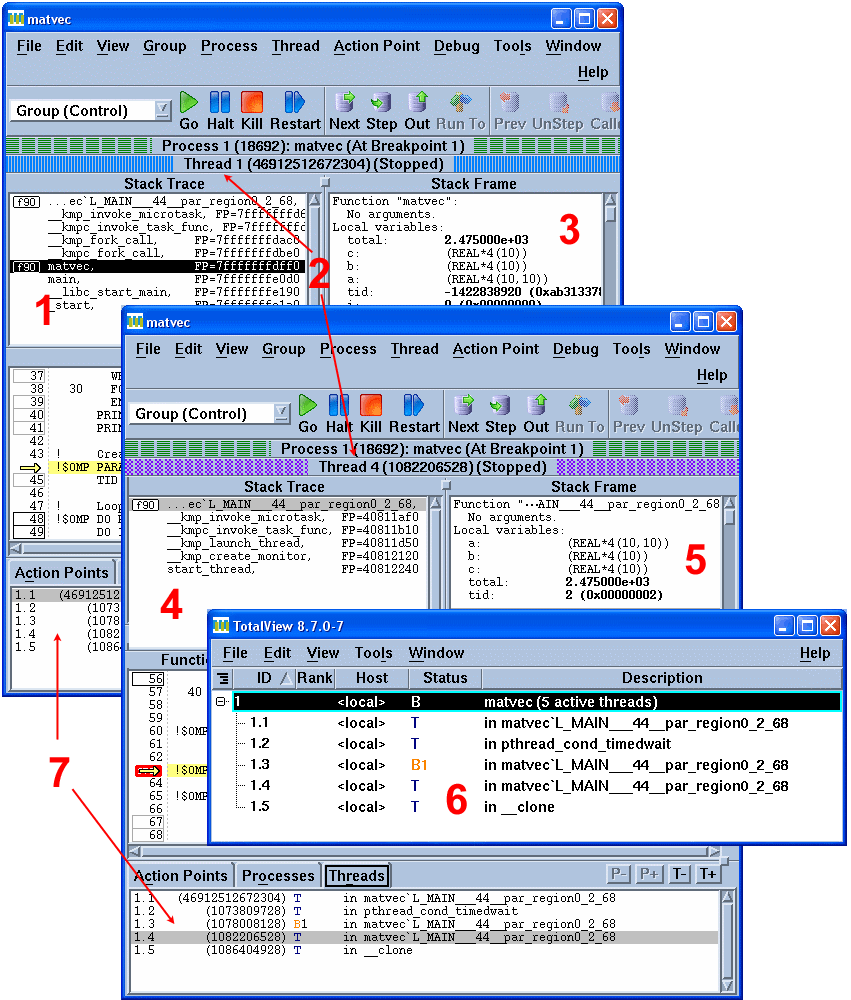
An example screenshot from a TotalView session using an OpenMP code is shown below.
- Master thread Stack Trace Pane showing original routine
- Process/thread status bars differentiating threads
- Master thread Stack Frame Pane showing shared variables
- Worker thread Stack Trace Pane showing outlined routine.
- Worker thread Stack Frame Pane
- Root Window showing all threads
- Threads Pane showing all threads plus selected thread

-
See the TotalView Debugger tutorial for details.
-
The Linux
pscommand provides several flags for viewing thread information. Some examples are shown below. See the man page for details.
% ps -Lf
UID        PID  PPID   LWP  C NLWP STIME TTY          TIME CMD
blaise   22529 28240 22529  0    5 11:31 pts/53   00:00:00 a.out
blaise   22529 28240 22530 99    5 11:31 pts/53   00:01:24 a.out
blaise   22529 28240 22531 99    5 11:31 pts/53   00:01:24 a.out
blaise   22529 28240 22532 99    5 11:31 pts/53   00:01:24 a.out
blaise   22529 28240 22533 99    5 11:31 pts/53   00:01:24 a.out

% ps -T
  PID  SPID TTY          TIME CMD
22529 22529 pts/53   00:00:00 a.out
22529 22530 pts/53   00:01:49 a.out
22529 22531 pts/53   00:01:49 a.out
22529 22532 pts/53   00:01:49 a.out
22529 22533 pts/53   00:01:49 a.out

% ps -Lm
  PID   LWP TTY          TIME CMD
22529     - pts/53   00:18:56 a.out
    - 22529 -        00:00:00 -
    - 22530 -        00:04:44 -
    - 22531 -        00:04:44 -
    - 22532 -        00:04:44 -
    - 22533 -        00:04:44 -
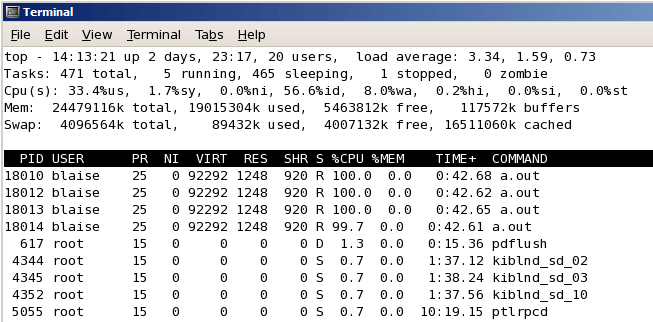
LC’s Linux clusters also provide the top command to monitor processes on a node. If used with the -H flag, the threads contained within a process will be visible. An example of the top -H command is shown below. The parent process is PID 18010 which spawned three threads, shown as PIDs 18012, 18013 and 18014.

Performance Analysis Tools:
-
There are a variety of performance analysis tools that can be used with OpenMP programs. Searching the web will turn up a wealth of information.
-
At LC, the list of supported computing tools can be found at: https://hpc.llnl.gov/software.
-
These tools vary significantly in their complexity, functionality and learning curve. Covering them in detail is beyond the scope of this tutorial.
-
Some tools worth investigating, specifically for OpenMP codes, include:
-
Open|SpeedShop
-
TAU
-
PAPI
-
Intel VTune Amplifier
-
ThreadSpotter
-


